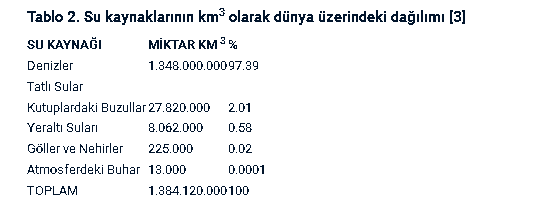
The Status of Water Resources Worldwide The total volume of water on Earth is 1.4 billion km³. Freshwater resources account for approximately 2.5% of the total water volume in the world. Of this amount, 68.7% (24 million km³) is found as ice and snow in mountainous regions, Antarctica, and the Arctic, while 30.1% (8 million km³) is found as groundwater.
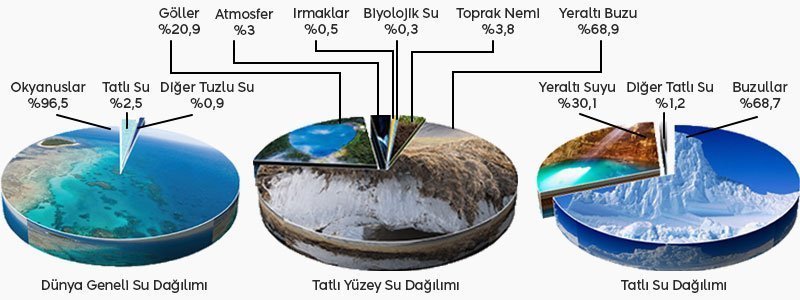 Figure 1. Distribution of Water in the World As seen in Figure 1, 97% of the world's water is saltwater. A large portion of freshwater is made up of icebergs and glaciers, which are quite difficult to access. Groundwater and surface water are the sources that people can obtain for drinking and usage, and the quantity and quality of these vary from year to year, depending on climate, population, or need. The scarcity of freshwater resources clearly indicates the necessity for the conservation, recovery, and development of these resources. The majority of the water needed comes from lakes and rivers. These lakes and rivers, which are surface freshwater sources, constitute only 1% of the total existing water.
 Distribution of Water Resources on the Earth's Surface
As seen in Table 1 prepared by the United Nations (UN), population density and clean water resources do not appear to be parallel in each continent. While there are regions with abundant water, there are also countries facing water scarcity that could lead to much more serious problems in the future [2]. 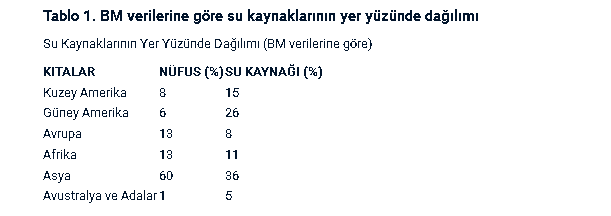
 More than 30% of the world's population is struggling with insufficient water supply issues. This rate could reach up to 60% in the next decade due to many reasons such as rapidly increasing population, rising usage requirements, climate changes that can disrupt the natural balance, global warming, and unintentional usage. It is projected that nearly 2 billion people will face water shortages by 2025 [2]. Freshwater, which constitutes a small portion of the total water on the Earth's surface, corresponds to a relatively high amount of approximately 22,770 m3 per person annually. However, despite this high amount per capita, the emergence of water issues is due to the limited nature of water as a resource over time and space.
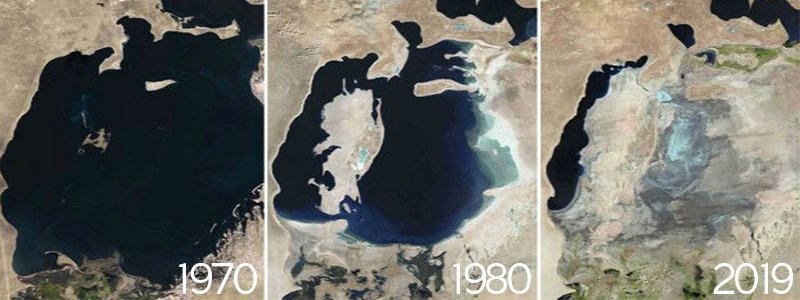
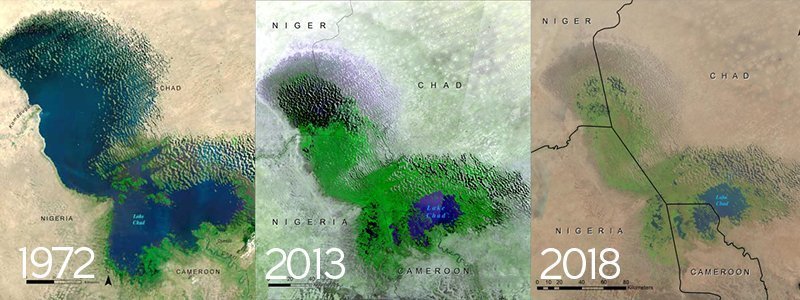
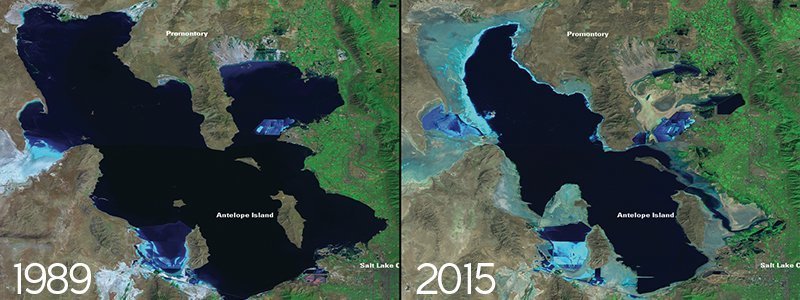
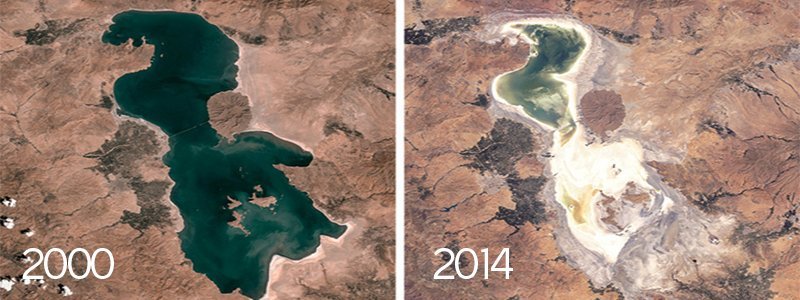
The variability in terms of water is significant. While there is an abundance of water in Northern Europe, Canada, or areas dominated by monsoon climates, water scarcity is experienced particularly in the world's semi-arid and arid regions. Although it is seen as having more water resources compared to other countries, it is not essentially a water-rich country.**Water Usage Areas in the World**Water resources and usage areas in the world can be proportionally diversified. When we look at the proportional distribution of usage water, we encounter rates of 69% for agricultural purposes, 19% for industrial use, and 12% for household consumption. Including bottled water, the share of freshwater in the beverage and food sector is even below 1%. A large portion of the 69% of water used for agricultural purposes loses its efficiency due to unconscious usage.**Status of Water Resources in the World**The effects of excessive extraction from both surface waters and groundwater are severe. The most striking example is the drastic reduction in the size of the Aral Sea and Lake Chad, as shown in Figures 4 and 5.Every passing moment, our water resources are diminishing globally, and we are often unaware of it. During this period when our water resources are facing depletion, people use them wastefully, thinking as if they have an unlimited supply. If it were known that every drop of water causes irreversible losses in our lives, perhaps the current images of the Aral Sea, Lake Chad, Lake Urmia, and similar bodies of water would not be so tragic.In West Africa, Lake Chad, located near the borders of Cameroon and Niger, has completely disappeared in the last 50 years. In 1963, the surface area of Lake Chad was measured at 25,000 km², but over the years, its volume has decreased by 95%, and by 2015, its surface area was approximately 1.3.It has been measured as 50 km² [5]. Figure 6. Great Salt LakeAccording to research conducted by the Journal of Great Lakes Research, in September 2014, it was revealed that the lake is at 12% of its average size from the 1970s [8]. In a report on Lake Urmia in 2017, it was stated that the water level decreased by 3 cm and that its area shrank by 36 km² over a two-week period [9].Figure 7. Lake Urmia
.jpg)